Ejemplo: Curvas de indiferencia#
Elaborado por: Alejandro Acosta
import numpy as np
import pandas as pd
import matplotlib.pyplot as plt
import seaborn as sns
plt.style.use('ggplot')
%matplotlib inline
import plotly.io as pio
import plotly.express as px
import plotly.offline as py
import plotly.graph_objects as go
delta = 0.025
x = np.arange(1, 10, delta)
y = np.arange(1, 10, delta)
X, Y = np.meshgrid(x, y)
Z = 2*X**0.5 * Y**0.5
fig, ax = plt.subplots()
CS = ax.contour(X, Y, Z, 10)
ax.set_aspect('equal', adjustable='box')
ax.clabel(CS, inline=True, fontsize=10)
ax.set_title('Curvas de indiferencia')
ax.set_xlabel('Bien X')
ax.set_ylabel('Bien Y')
Text(0, 0.5, 'Bien Y')
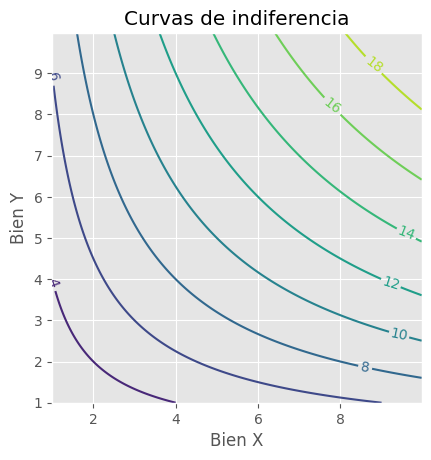
fig = go.Figure(data=[go.Surface(z=Z)])
fig.update_traces(contours_z=dict(show=True, usecolormap=False,
highlightcolor="white", project_z=True))
fig.update_layout(title='Curvas de indiferencia', autosize=False,
scene_camera_eye=dict(x=-1.3, y=-1.3, z=1.3),
width=900, height=700,
margin=dict(l=65, r=50, b=65, t=90)
)
fig.show()